Fixing memory leaks with Detached Elements DevTool
An example of using Microsoft Edge's Detached Elements DevTool to fix a memory leak.
Thanks to the Detached Elements tool, we discovered 3 memory leaks in our React application.
Microsoft Edge's Detached Elements tool
To help find and fix DOM memory leaks, the Microsoft Edge team collaborated with Microsoft Teams to build a tool that detects and displays the detached elements on a page.
Thanks to the Detached Elements tool, we discovered 3 memory leaks in our React application. Let's take a look how it works.
What is a detached element?
A detached element is a DOM-node which is removed, but still held in reference. If this reference isn't cleand up, a memory leak is created.
const cards = [];
const cardElement = document.querySelector('.card');

cardElement.remove();
cards.push(cardElement);
// DOM element removed but still being used in an array
Debugging memory leaks
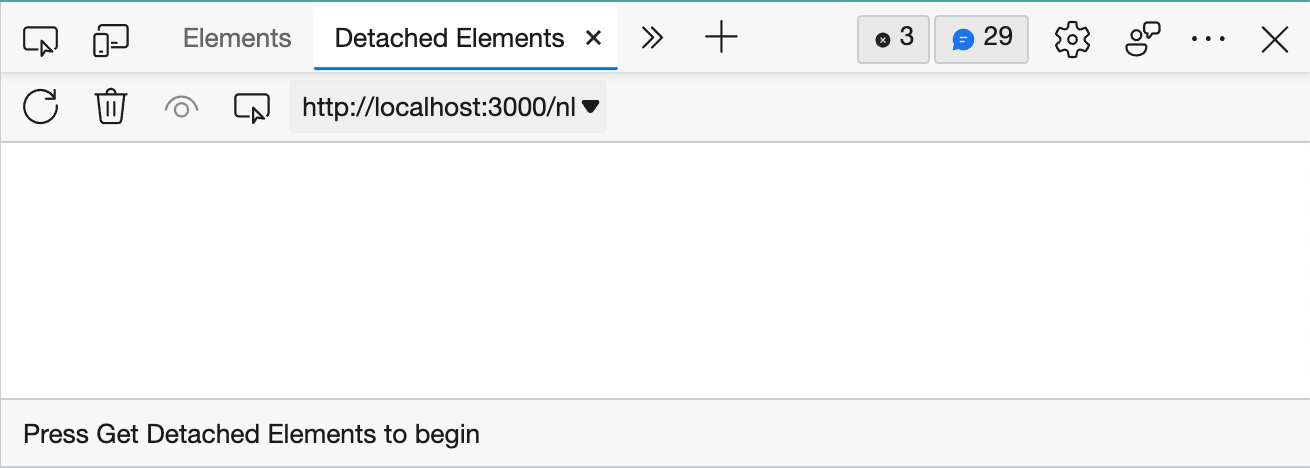
Surf to a specific page on which you want to check for memory leaks and open up the DevTools. Click on the three dots (Customize and control devtools), hover over More tools and select Detached Elements. You will now see something like this:

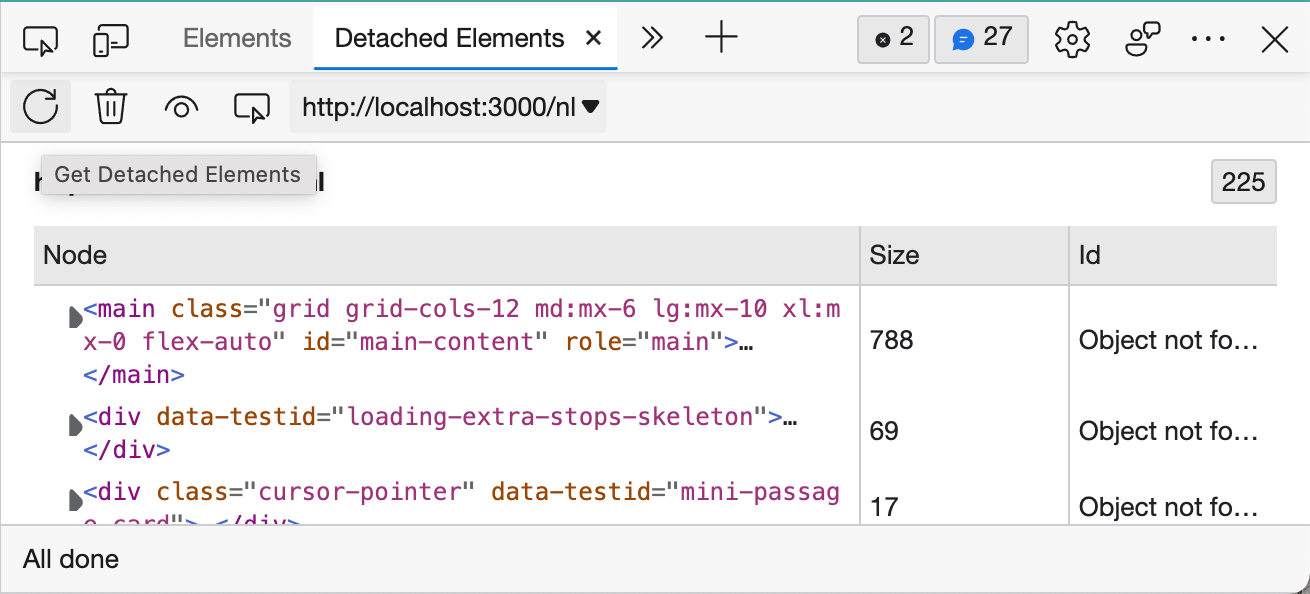
Now, navigate to a different page on the website/app and click on the Detached Elements button(refresh icon).

All the detached elements are displayed in a list. There are 225 detached elements in this example. The amount is displayed in the upper right corner.
Follow these steps to see which detached elements can't be cleaned up by the garbage collector:
- click on Collect Garbage (garbage icon)
- click on Get Detached Elements (refresh icon)
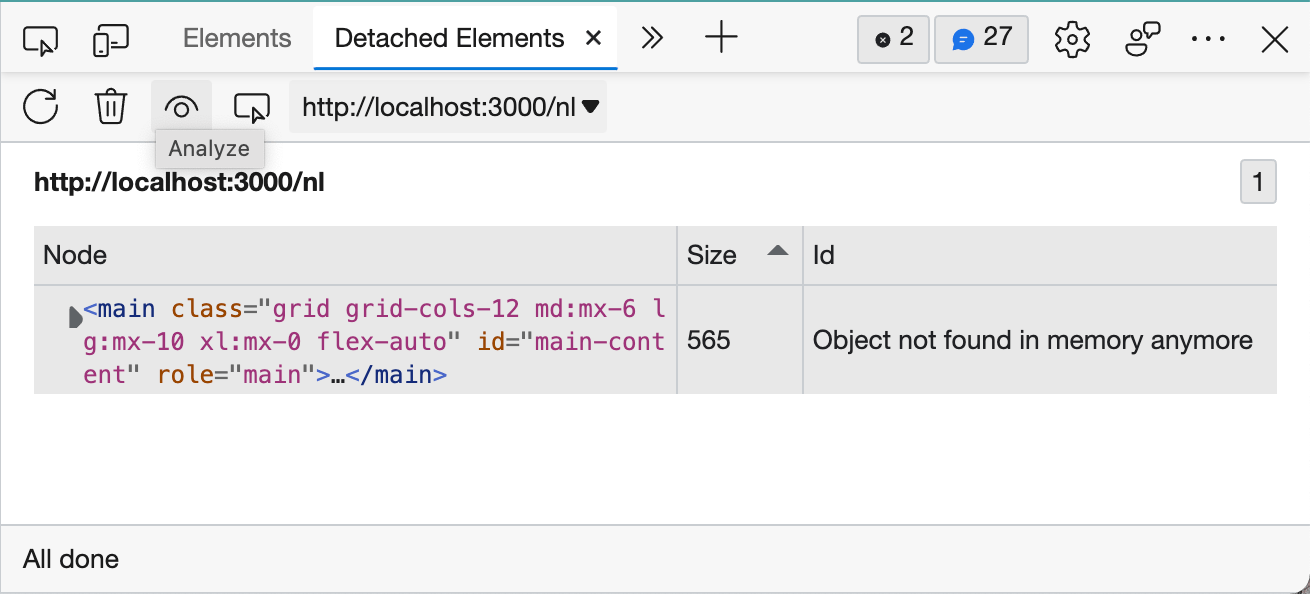
The list is now updated. Currently, our detached element displays the following message:
Object not found in memory anymore

Clicking Analyze(eye icon) opens the Memory tool and records a heap snapshot. A heap snapshot displays information about how the memory used by your page is distributed among the JavaScript and DOM objects that it uses, at a specific point in time.
The "Object not found" message is now replaced by an id. (e.g.: @130265)
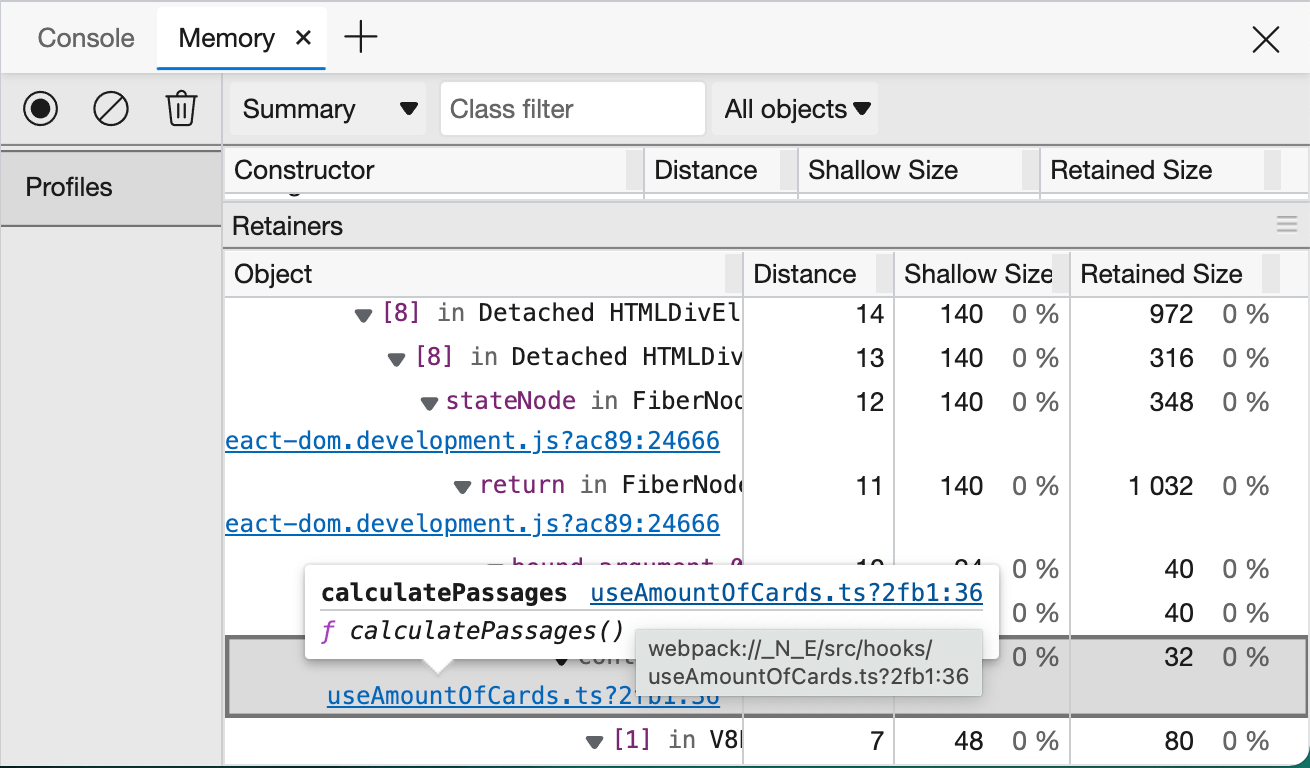
After clicking the Id, the Memory tool scrolls directly to the right line in the heap snapshot and shows the list of retainers. This means that for any detached element, we can know which object in our JavaScript program still refers to it.

Memory leak found
useAmountOfCards.ts is a custom React Hook which we use to determine how much cards we should render after a resize-event.
The Memory tool also tells us that calculatePassages() function is the culprit.
After inspecting this function, we noticed that the removeEventListener wasn't called correctly resulting in not removing the event listener.
Repeat this process to see if there are any other memory leaks in your application.
Microsoft appreciation message
I would like to give a small appreciation message to Microsoft for providing us with a lot of great tools like Visual Studio Code, Microsoft Edge and many more. The addition of the Detached Elements tool in Edge is a great example that they're actively improving the developer experience. Thank you!
Goodbye Chrome, Hello Edge
At the end of 2020, I've switched over from Google Chome to Microsoft Edge because Chrome was frequently using a lot of memory. This resulted in my Macbook Pro getting hot and sounding like it was going to take off any second. The problem went away when I started using Edge.
Because Edge uses Chromium under the hood, the DevTools look very familiar so the change wasn't that hard. Chrome is still a great browser but for now Edge is my default browser for browsing and developing.

I recently bought a copy of Kitze's Sizzy App which claims to be the browser for developers. After using it for a couple of hours, I'm convinced by its potential but I need to familiarise myself more before switching over. I'm hoping to come back to this in a future blogpost.
Links
- Microsoft Blogs: Debug memory leaks with the Microsoft Edge Detached Elements tool
- Youtube: Debug memory leaks with the Microsoft Edge Detached Elements tool
- Youtube: What's New in DevTools 97 - Detached Elements
- Microsoft Docs: What's New in DevTools (Microsoft Edge 97)
- Header image by Shane Rounce (Unsplash.com)